Sylwia

Monitoring systems with Wazuh. Compliant with NIS2.

Implementing monitoring using the Wazuh platform can be broken down into five key steps that allow you to fully leverage its potential as a unified XDR and SIEM solution. Below is a description of this process, including cloud hosting options:

1. Choosing an implementation model (Cloud vs. On-premises)

The first step is to decide whether the system will be hosted locally or in the cloud. Wazuh Cloud offers managed, ready-to-use, and highly scalable environments for security monitoring and endpoint protection. Choosing the cloud eliminates the need to manage server infrastructure yourself, and users can take advantage of a free trial (Free Cloud Trial) to test the platform. This solution provides protection for public clouds, private clouds, and on-premises data centers.

2. Installation and configuration of the central platform

After selecting a model, you need to install the Wazuh server. This platform is an open source solution, which ensures transparency, flexibility, and no license fees. For self-installation, you can use comprehensive documentation that offers step-by-step guides for users of all skill levels. If you choose the cloud, this step is simplified because the environment is delivered ready to use.

3. Deployment of agents on endpoints

Wazuh uses a single-agent architecture that unifies historically separate functions. Agents must be installed on monitored devices (endpoints) and cloud workloads. These agents are highly flexible and allow you to collect logs and create the necessary alerts.

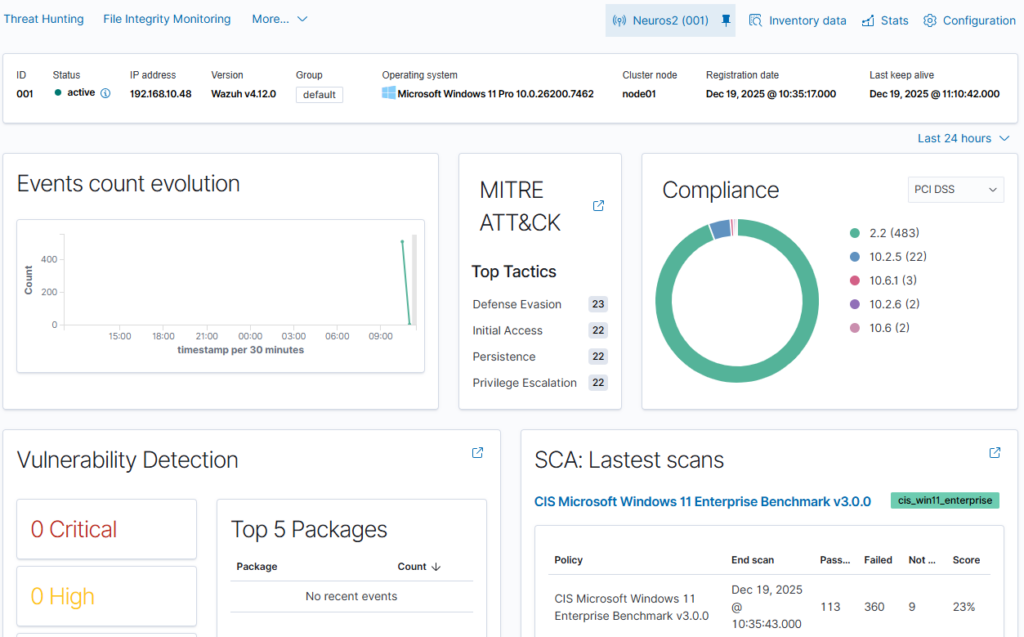
4. Configuration of protection and detection modules

After connecting the agents to the platform, specific security functions must be configured, such as:

  • Endpoint security: File integrity monitoring (FIM), malware detection, and configuration assessment.
  • Threat analysis: Vulnerability detection and log data analysis.
  • Cloud security: Posture management and container protection.

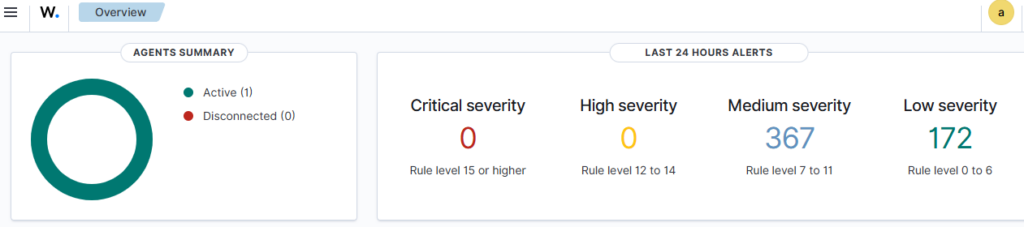
5. Launch security operations and active response

The final step is to configure real-time monitoring and incident response. As a SIEM solution, Wazuh provides monitoring, detection, and notification of security events. With XDR capabilities, the platform provides analysts with real-time data correlation and active responses, which include automatic remediation actions on devices to keep them running smoothly. Integration with external tools such as VirusTotal and PagerDuty is also possible, further enhancing response capabilities.

An analogy for better understanding: Implementing the Wazuh solution can be compared to building a modern building security system. Choosing the cloud (Wazuh Cloud) is like hiring a professional company that provides a ready-made monitoring center, while agents are like smart sensors installed in each room. When a sensor detects smoke or unauthorized entry, the system not only triggers an alarm (SIEM), but can also automatically shut off the gas supply or lock the doors (XDR) to minimize damage.


Monitoring systems with Wazuh. Compliant with NIS2. Read More »

Log collection and monitoring using Grafana Cloud and Grafana Alloy. Logs compliant with NIS2.

The key steps for collecting logs and monitoring systems using Grafana Cloud and Grafana Alloy focus on the comprehensive telemetry lifecycle: from collection, through processing and storage, to visualization and response.
Here are the most important steps based on the functionalities of these tools:

1. Collecting telemetry data with Grafana Alloy
Grafana Alloy serves as a distribution of OpenTelemetry Collector that combines the strengths of leading collectors, enabling the collection, processing, and export of telemetry signals for scaling observability
• Alloy implementation: Install and configure Grafana Alloy on your target platforms (such as Linux, Windows, Docker, Kubernetes).
• Collect all signals: Use Alloy to collect all types of telemetry data—including logs, metrics, traces, and profiles (profiling).
• Pipeline configuration: Leverage native pipelines for leading telemetry signals such as Prometheus and OpenTelemetry. Alloy allows you to configure Kubernetes log collection, log file monitoring, and OpenTelemetry data collection.
Installing Alloy on Windows systems:

Verifying that Alloy is installed correctly:

2. Data transfer and storage in Grafana Cloud (LGTM+ Stack)
Once collected, data must be transferred to the appropriate cloud backends, which manage its scalable storage and retrieval. Grafana Cloud provides the LGTM+ Stack, which includes specialized systems for handling each type of data.
• Logs: Send logs to Grafana Loki, which is a multi-tenant log aggregation system. Alloy has dedicated components (e.g., loki.write) and tutorials for sending logs to Loki.
• Metrics: Send metrics to Grafana Mimir (a scalable and efficient metrics backend) and Prometheus. Alloy can send metrics to Prometheus.
• Traces: Store traces in Grafana Tempo (a backend for large-scale distributed tracing).

3. Data visualization and correlation (Grafana)
Grafana is used to query, visualize, and alert on data, regardless of where it is stored.
• Connecting data sources: Instantly connect all your data sources to Grafana, including infrastructure monitoring (e.g., Linux, Windows, AWS, Google Cloud) and application monitoring (e.g., MongoDB, Splunk).
• Creating dashboards: Create, explore, and share dashboards to gain insight into metrics. Take advantage of end-to-end solutions and dashboard templates.

4. Setting up advanced monitoring and alerting
Monitoring requires defining performance indicators and establishing mechanisms for reporting issues.
• Alerting: Configure alerts in Grafana that can be triggered from any data source.
• SLO management: Easily create, manage, and scale Service Level Objectives (SLOs) and error budget alerts in Grafana Cloud.
• Root cause analysis: Apply Contextual Root Cause Analysis, which automatically correlates related issues to uncover causes faster.
• AI/ML-powered insights: Leverage AI/ML capabilities in Grafana Cloud to identify anomalies and reduce labor intensity.

5. Incident response management (IRM)
The final key step is to respond quickly to issues detected during monitoring.
• Incident response: Detect and respond to incidents with a simplified workflow offered by Incident Response Management (IRM).
• On-call management: Leverage flexible on-call management, reducing labor intensity with simpler interfaces.

Log collection and monitoring using Grafana Cloud and Grafana Alloy. Logs compliant with NIS2. Read More »

III Meetup IT

Conductor -Seweryn Stachowicz ( Soft skils , Devops)

Quartet from the State School of Music I and II degree in Mielec, conducted by Zdzislaw Szymczyk

Cyber security, European Funds FENG 2021 – 2027 Włodzimierz Adamski

Cyber Security, TISAX – Tomasz Szczygieł

Azure Containers Apps Michal Machniak ( Evangelist of Microsoft Technology | Community Lead | Senior Ops | DevOps)

Databriks- practical application Łukasz Noga – ( BI /SQL )


III Meetup IT Read More »

I Meetup IT Mielec

Link to agenda (registration form):
https://www.meetup.com/Meetup-Mielec-IT/events/280987596/

Abbreviated agenda:

(18:00) Welcoming the assembled guests Joanna Stachowicz
(18:05) Short concert performed by a string quartet from the State Music School in Mielec – Ryszard Kusek Ph.
(18:20) Lecture – “Information Technology in the Polish industry – development and current European Funds FENG 2021-2027” – Wlodzimierz Adamski Ph.
(18:35) Lecture and discussion – “Empathy in IT” – Seweryn Stachowicz
(19:30) Lecture and discussion – “Data Lakes” – Łukasz Noga
(20:00) Lecture and online panel – “10 years of living with the cloud – what have we learned from cloud deployments in Europe and the World!” – Michał Furmankiewicz

The event was held under the Honorary Patronage of the Mayor of Mielec – Jacek Wiśniewski.

I Meetup IT Mielec Read More »

Social Media Auto Publish Powered By : XYZScripts.com
Scroll to Top