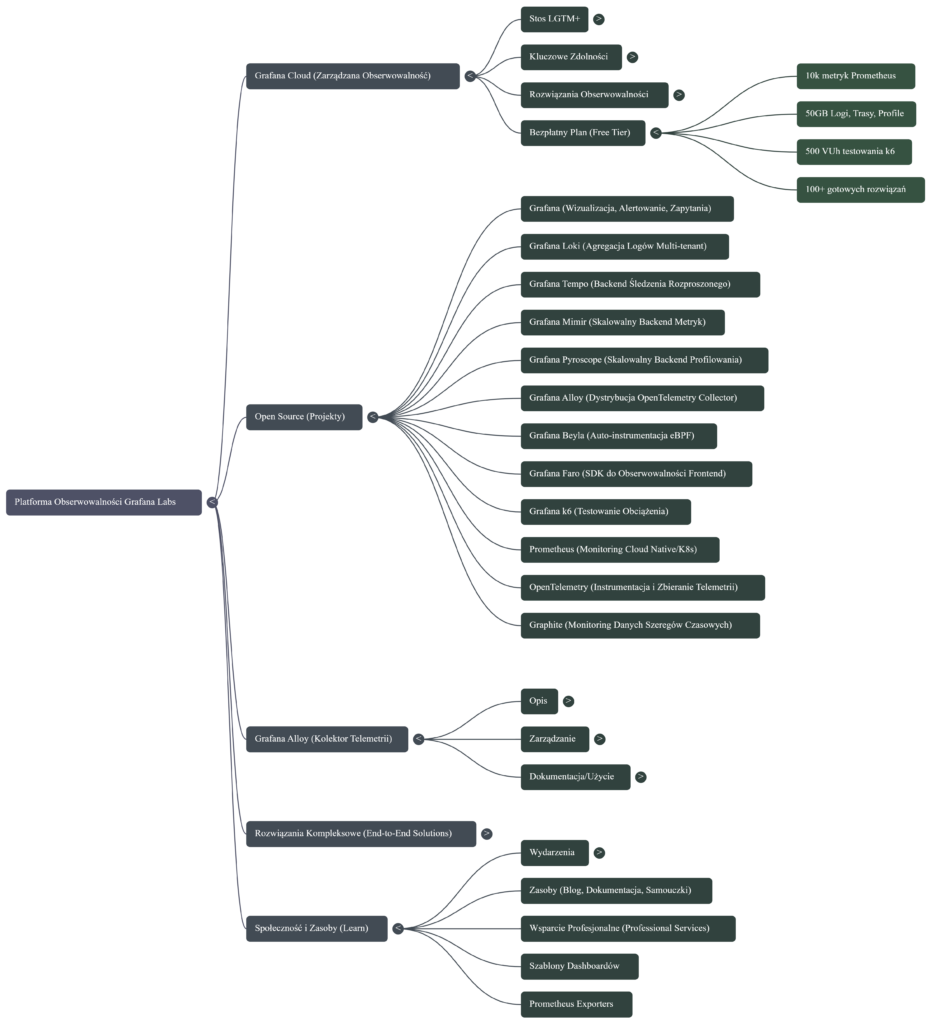
Log collection and monitoring using Grafana Cloud and Grafana Alloy. Logs compliant with NIS2.
The key steps for collecting logs and monitoring systems using Grafana Cloud and Grafana Alloy focus on the comprehensive telemetry lifecycle: from collection, through processing and storage, to visualization and response.
Here are the most important steps based on the functionalities of these tools:
1. Collecting telemetry data with Grafana Alloy
Grafana Alloy serves as a distribution of OpenTelemetry Collector that combines the strengths of leading collectors, enabling the collection, processing, and export of telemetry signals for scaling observability
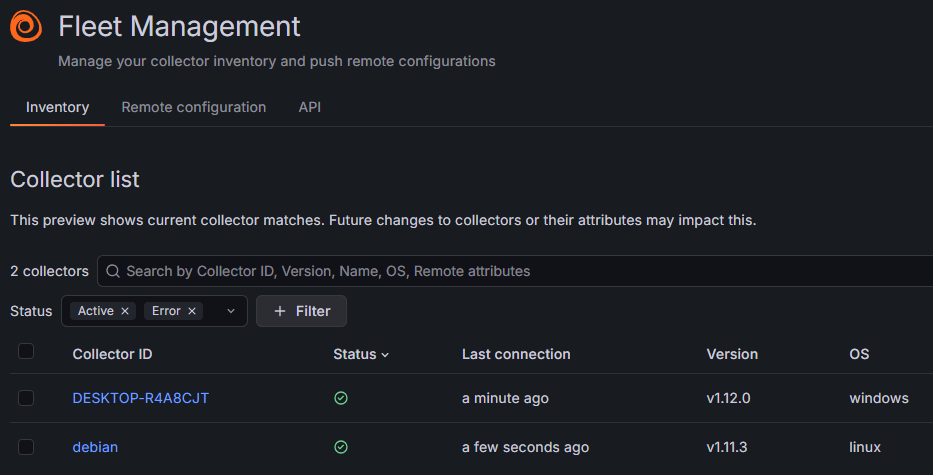
• Alloy implementation: Install and configure Grafana Alloy on your target platforms (such as Linux, Windows, Docker, Kubernetes).
• Collect all signals: Use Alloy to collect all types of telemetry data—including logs, metrics, traces, and profiles (profiling).
• Pipeline configuration: Leverage native pipelines for leading telemetry signals such as Prometheus and OpenTelemetry. Alloy allows you to configure Kubernetes log collection, log file monitoring, and OpenTelemetry data collection.
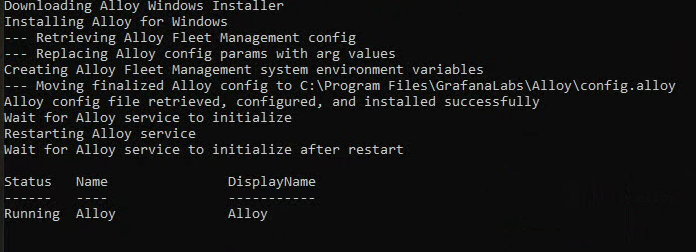
Installing Alloy on Windows systems:
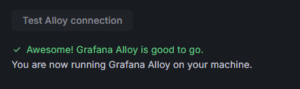
Verifying that Alloy is installed correctly:
2. Data transfer and storage in Grafana Cloud (LGTM+ Stack)
Once collected, data must be transferred to the appropriate cloud backends, which manage its scalable storage and retrieval. Grafana Cloud provides the LGTM+ Stack, which includes specialized systems for handling each type of data.
• Logs: Send logs to Grafana Loki, which is a multi-tenant log aggregation system. Alloy has dedicated components (e.g., loki.write) and tutorials for sending logs to Loki.
• Metrics: Send metrics to Grafana Mimir (a scalable and efficient metrics backend) and Prometheus. Alloy can send metrics to Prometheus.
• Traces: Store traces in Grafana Tempo (a backend for large-scale distributed tracing).
3. Data visualization and correlation (Grafana)
Grafana is used to query, visualize, and alert on data, regardless of where it is stored.
• Connecting data sources: Instantly connect all your data sources to Grafana, including infrastructure monitoring (e.g., Linux, Windows, AWS, Google Cloud) and application monitoring (e.g., MongoDB, Splunk).
• Creating dashboards: Create, explore, and share dashboards to gain insight into metrics. Take advantage of end-to-end solutions and dashboard templates.
4. Setting up advanced monitoring and alerting
Monitoring requires defining performance indicators and establishing mechanisms for reporting issues.
• Alerting: Configure alerts in Grafana that can be triggered from any data source.
• SLO management: Easily create, manage, and scale Service Level Objectives (SLOs) and error budget alerts in Grafana Cloud.
• Root cause analysis: Apply Contextual Root Cause Analysis, which automatically correlates related issues to uncover causes faster.
• AI/ML-powered insights: Leverage AI/ML capabilities in Grafana Cloud to identify anomalies and reduce labor intensity.
5. Incident response management (IRM)
The final key step is to respond quickly to issues detected during monitoring.
• Incident response: Detect and respond to incidents with a simplified workflow offered by Incident Response Management (IRM).
• On-call management: Leverage flexible on-call management, reducing labor intensity with simpler interfaces.