Infrastructure monitoring is one of the basic elements used to predict failures.
Various tools can be implemented for monitoring, from Nagios to Zabbix.
In this case, we want to focus on implementing Zabbix.
- Server selection and installation
Zabbix can be installed in several ways, including from packages, on an on-premises environment, for example for Red Hat Enterprise Linux or Debian/Ubuntu systems, and using containers. Alternatively, the Zabbix server can be deployed in a cloud environment (Azure, GC, Amazon, or other environment). The installation process also includes the installation of the web interface.
2. Agent installation
After installing the server, it is necessary to deploy monitoring agents on the hosts to be monitored. Zabbix supports various types of agents, including Zabbix Agent and Zabbix Agent 2. Installation instructions are available for Windows using the MSI package and for macOS using PKG. Zabbix agents can be configured using user parameters to extend their functionality
![]()
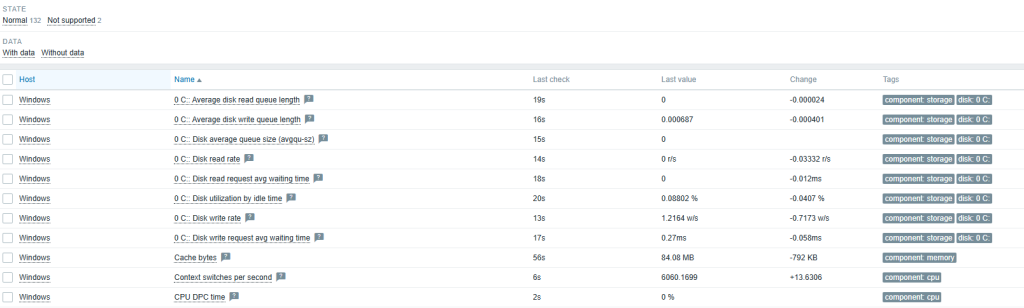
3. Initial configuration of hosts and monitoring items
After installing Zabbix and agents, the next step is to add monitored units. As part of the configuration, use the Host Wizard, configure host groups, and add a new host to the system. As part of the host configuration, define items that specify what data is to be collected, for example, via a Zabbix agent, SNMP agent, or HTTP agent. The configuration also includes creating triggers (triggers)
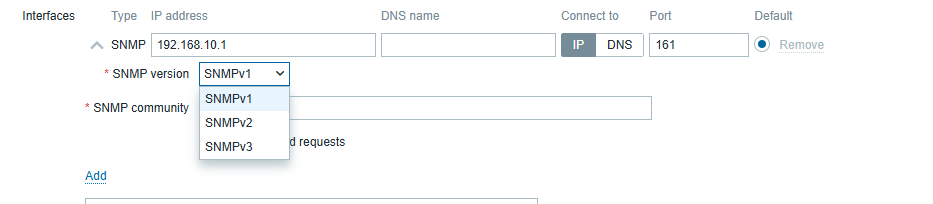
4. Monitoring configuration via SNMP
Monitoring via an SNMP agent is one of many types of items supported by Zabbix. SNMP monitoring configuration allows the use of special OIDs, MIB files, and dynamic indexes. Zabbix is also capable of handling SNMP traps. In addition, low-level discovery can be used to automatically detect SNMP OIDs. Quick reference guides include monitoring a network switch or router with Zabbix
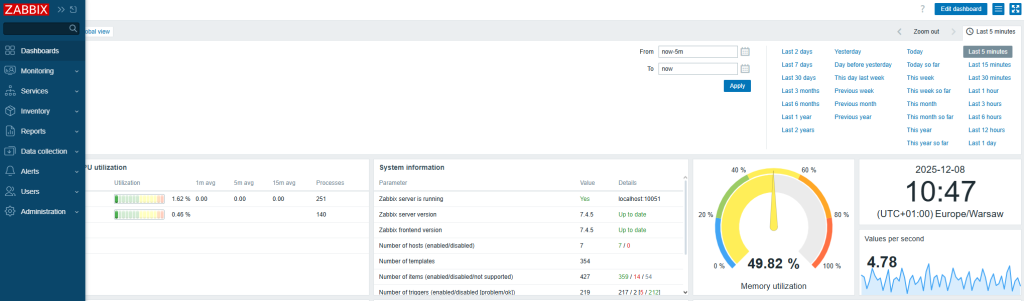
5. Dashboard configuration
Dashboards are a key element of the visualization section in the Zabbix web interface. They allow you to view key information and system statuses. Dashboards are built using various widgets. Examples of widgets that can be configured include: Graph (classic), Problems, Problems by severity, System information, Top hosts, and URL. They can be managed using the API, including creation (dashboard.create), deletion (dashboard.delete), and updating (dashboard.update).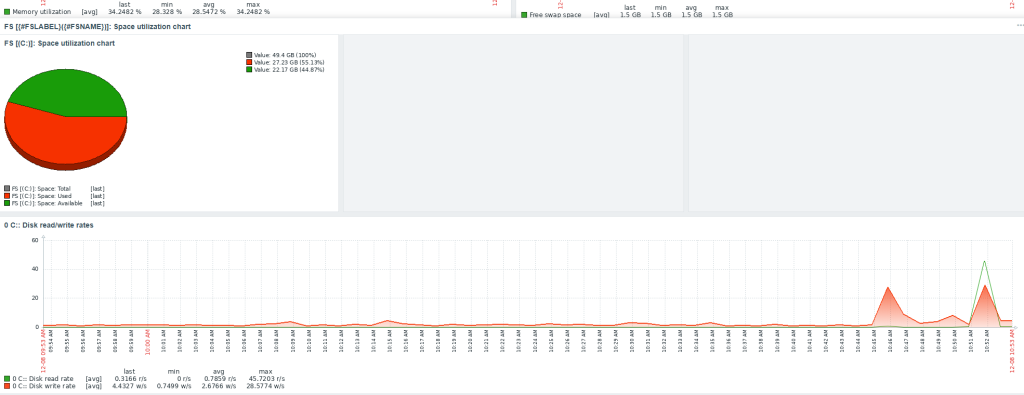
Feel free to contact us.